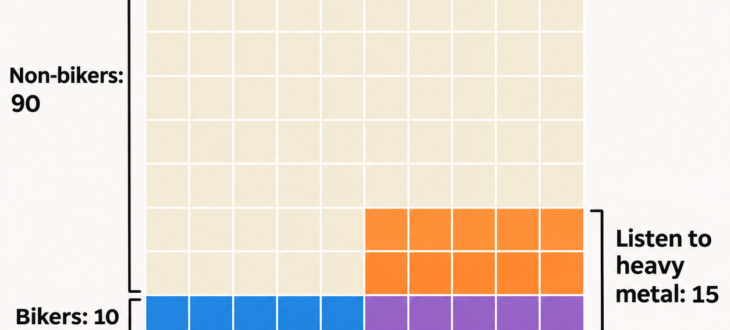
In a population of 100 people, 10 are bikers and 15 listen to heavy metal. Five belong to both groups:
+--------------+------------------------+------------------------------+-------+
| Group        | Listen to heavy metal  | Do not listen to heavy metal | Total |
+--------------+------------------------+------------------------------+-------+
| Bikers       |           5            |              5               |  10   |
| Non-bikers   |          10            |             80               |  90   |
+--------------+------------------------+------------------------------+-------+
| Total        |          15            |             85               | 100   |
+--------------+------------------------+------------------------------+-------+
Among bikers, 50% listen to heavy metal (5 out of 10); among non-bikers, the figure is 11.1% (10 out of 90). So a randomly selected biker is more likely to listen to heavy metal than a randomly selected non-biker.
Yet two-thirds of heavy metal listeners are non-bikers (10 out of 15), because non-bikers greatly outnumber bikers. There is no contradiction: the denominator changes.
The figures show an association, but they do not prove that one characteristic causes the other.
